Manufacturers in 2026 are under constant pressure to produce more, reduce waste, maintain quality, and keep production costs under control. With smart factories, connected machines, automation, and real-time analytics becoming more common, companies have access to more production data than ever. However, having data is not enough. Manufacturers need practical metrics that turn this information into decisions.
One of the most important metrics for understanding manufacturing productivity is Overall Equipment Effectiveness, commonly known as OEE. Effective OEE measurement manufacturing strategies help companies identify where production losses occur and determine which improvements can deliver the greatest impact.
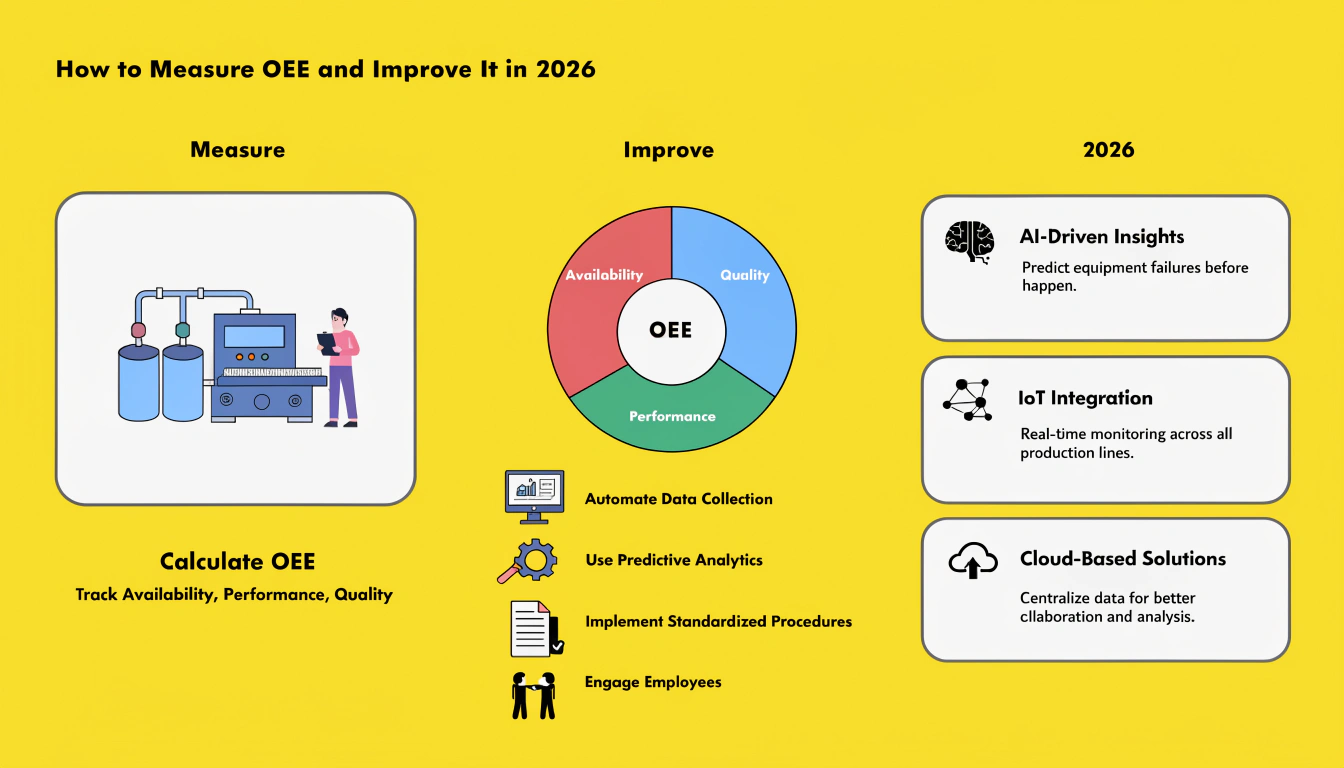
OEE measures how effectively equipment is being used by combining three critical factors: availability, performance, and quality. When these three components are analyzed together, manufacturers can see whether machines are actually delivering their maximum productive potential.
In 2026, OEE is becoming even more valuable as manufacturers connect machines through industrial IoT platforms, manufacturing execution systems, digital twins, artificial intelligence, and predictive maintenance technologies.
This overall equipment effectiveness guide explains how OEE works, how to calculate it, which losses affect the score, and how manufacturers can improve OEE using modern technologies and practical improvement strategies.
What Is OEE?
Overall Equipment Effectiveness is a performance metric used to measure how effectively a manufacturing machine, production line, or process is being utilized.
OEE considers three major dimensions:
Availability: How much of the planned production time is actually available for manufacturing?
Performance: How fast is the equipment operating compared with its ideal production speed?
Quality: How many products are produced correctly without defects or rework?
The standard OEE formula is:
OEE = Availability × Performance × Quality
Each component is expressed as a percentage.
For example, if a machine has:
- Availability = 90%
- Performance = 85%
- Quality = 98%
The OEE would be:
90% × 85% × 98% = 74.97%
This means the machine is effectively producing good-quality products at approximately 75% of its theoretical maximum productive capability during planned production time.
The purpose of OEE is not simply to generate a percentage. The real value comes from understanding why the number is high or low.
Why OEE Measurement Matters in Manufacturing in 2026
Modern manufacturers are increasingly moving from reactive production management toward data-driven operations. Machines are generating information about cycle times, downtime, temperature, vibration, quality, energy consumption, and maintenance conditions.
Without a structured measurement framework, much of this information remains disconnected.
That is where OEE becomes useful.
A strong OEE measurement manufacturing strategy can help organizations identify equipment losses, compare production lines, monitor improvement projects, prioritize maintenance activities, and establish measurable performance targets.
For example, a production line may have an OEE score of 70%. Management might initially assume that the machine requires an upgrade. However, a detailed analysis could reveal that the main issue is frequent changeover time rather than machine capability.
Another facility might have excellent availability but poor performance because equipment frequently runs below its ideal speed.
By separating availability, performance, and quality, OEE provides a clearer picture of operational performance.
Understanding the Three Components of OEE
1. Availability
Availability measures whether equipment is available to produce when it is scheduled to operate.
The basic formula is:
Availability = Operating Time ÷ Planned Production Time × 100
Planned production time refers to the time during which the machine is expected to produce.
Operating time is the planned production time minus downtime.
Downtime can include equipment breakdowns, setup and changeovers, material shortages, tooling problems, operator-related delays, and other interruptions.
For example, suppose a machine is scheduled to run for 480 minutes. If it loses 60 minutes to breakdowns and changeovers, its operating time is 420 minutes.
Availability would therefore be:
420 ÷ 480 × 100 = 87.5%
Manufacturers can improve availability by focusing on preventive maintenance, predictive maintenance, faster changeovers, spare-parts availability, operator training, and better production scheduling.
2. Performance
Performance measures whether equipment is operating at its ideal speed while it is running.
A machine can be available for production but still perform below expectations.
The performance calculation can be expressed as:
Performance = (Ideal Cycle Time × Total Units Produced) ÷ Operating Time × 100
Common performance losses include slow machine speeds, minor stoppages, inefficient machine settings, inconsistent material feeding, and operator-related interruptions.
For instance, a machine may be designed to produce one unit every 10 seconds, but actual production may average 13 seconds per unit.
That difference may appear small, but over thousands of production cycles, it can significantly reduce output.
3. Quality
Quality measures how many products meet specifications without defects, scrap, or rework.
The formula is:
Quality = Good Units ÷ Total Units Produced × 100
If a line produces 10,000 units and 300 require rework or are rejected, only 9,700 units are classified as good units.
Quality losses can result from incorrect machine settings, material variation, equipment wear, process instability, inadequate inspection, or human error.
Improving quality is important not only because defective products reduce the OEE score but also because scrap and rework increase production costs and consume additional resources.
How to Perform OEE Measurement Manufacturing Teams Can Trust
Accurate data is the foundation of effective OEE.
Manufacturers should begin by clearly defining the equipment, production period, planned production time, ideal cycle time, total output, good output, and downtime categories.
The next step is to standardize data collection.
Historically, many factories have relied on manual logs or spreadsheets. While these can be useful for starting an OEE program, they can introduce inconsistent reporting and delayed information.
In 2026, connected production environments provide more advanced options.
Industrial IoT sensors can collect machine-state information automatically. PLCs and industrial controllers can provide machine signals, while MES platforms can combine production information with schedules, downtime, and quality data.
Manufacturers can then use dashboards to monitor OEE in real time.
However, technology should not replace process discipline. A connected system with poor downtime classifications can still produce misleading OEE results.
Teams should therefore create standardized downtime categories and train operators on how to record events consistently.
Establish a Reliable Baseline
Before trying to improve OEE, manufacturers need to understand their current performance.
A common mistake is to immediately introduce improvement initiatives without establishing a reliable baseline.
Companies should measure OEE consistently over a meaningful period rather than relying on a single shift or day.
The baseline should show:
- Current OEE
- Availability
- Performance
- Quality
- Major downtime causes
- Production losses
- Scrap and rework
- Changeover duration
This information helps identify where improvement efforts should be concentrated.
For example, if quality is consistently above 98% but availability is only 75%, focusing heavily on quality may not produce meaningful gains. The largest opportunity may instead be downtime reduction.
Use the Six Big Losses to Find Improvement Opportunities
OEE analysis is commonly connected to the six major production losses.
They include equipment failures, setup and adjustment losses, idling and minor stoppages, reduced speed, process defects, and reduced yield.
These losses can be grouped into the three OEE components.
Breakdowns and setup time primarily affect availability. Minor stops and reduced speed affect performance. Defects and startup losses affect quality.
Manufacturers should avoid treating all downtime as one category.
For example, recording every interruption simply as “machine downtime” makes it difficult to understand what is actually causing lost production.
Instead, teams should identify specific causes.
If changeovers account for a large share of lost production time, SMED principles can help reduce setup time. If equipment failures dominate, maintenance optimization may provide a greater return.
This approach transforms OEE from a reporting metric into an improvement tool.
How to Improve OEE in 2026
Improving OEE requires a combination of operational discipline, employee involvement, technology, and continuous improvement.
Reduce Unplanned Downtime
One of the fastest ways to improve OEE is to reduce unexpected equipment failures.
Manufacturers can move beyond purely reactive maintenance by combining preventive and predictive approaches.
Sensors can monitor vibration, temperature, pressure, current, lubrication conditions, and other equipment signals. Analytics platforms can then identify patterns associated with developing equipment problems.
Predictive maintenance can allow maintenance teams to intervene before a failure stops production.
However, not every machine needs advanced predictive analytics. Manufacturers should prioritize critical assets where downtime has the greatest operational or financial impact.
Improve Changeover Time
Frequent product changes can significantly reduce availability.
Manufacturers can analyze every stage of the changeover process and determine which activities can be completed while equipment is still operating.
SMED methodology can help organizations separate internal and external setup activities, simplify adjustments, standardize tools, and reduce unnecessary movement.
Even small reductions in changeover time can increase available production capacity without purchasing additional equipment.
Eliminate Minor Stops
Minor stoppages can be particularly difficult to identify because individual events may only last a few seconds or minutes.
Over a full shift, however, hundreds of small interruptions can result in substantial lost production.
Automated machine monitoring can capture these events more accurately than manual reporting.
Once the largest recurring causes are identified, teams can investigate issues such as sensor alignment, material feeding, jams, tooling, machine configuration, or operator interaction.
Increase Machine Speed Without Sacrificing Quality
Improving performance does not mean simply increasing machine speed.
Running equipment faster can create additional defects, jams, wear, or safety concerns.
Manufacturers should identify the ideal operating range for each process and gradually optimize machine parameters.
Digital process monitoring and analytics can help identify operating conditions that provide the best balance between speed, quality, energy consumption, and equipment health.
Improve Quality at the Source
Quality problems should ideally be detected and prevented as close to the source as possible.
Automated inspection systems, machine vision, sensors, statistical process control, and real-time analytics can identify deviations earlier.
Instead of waiting until an entire batch is complete, manufacturers can monitor process conditions continuously and intervene when parameters begin moving outside acceptable limits.
This reduces scrap and rework while protecting OEE.
Use AI and Analytics to Make OEE More Actionable
Artificial intelligence is becoming increasingly relevant to manufacturing performance management in 2026.
Instead of simply displaying an OEE score, AI-powered analytics can help identify patterns across production data.
For example, an analytics system might identify that performance drops consistently during certain shifts, after specific changeovers, or when a particular raw material batch is used.
Machine learning can also support predictive maintenance and anomaly detection.
However, manufacturers should not adopt AI simply because it is a current trend. The objective should be to solve specific operational problems.
AI is most valuable when it turns large amounts of manufacturing data into practical actions that production, maintenance, and quality teams can implement.
Connect OEE With Digital Manufacturing Systems
OEE becomes more powerful when it is connected to other manufacturing systems.
Integration with MES can provide production scheduling and work-order context. ERP systems can connect operational performance with inventory, procurement, and financial data.
Industrial IoT platforms can supply machine data, while digital twins can help manufacturers model production scenarios and identify potential improvements.
This connected approach creates a more comprehensive view of factory performance.
For example, a low OEE score might initially appear to be an equipment issue. But connected data could show that the underlying cause is material availability, scheduling changes, or excessive product variation.
Set Realistic OEE Targets
There is no universal OEE target that every manufacturer should pursue.
OEE should be evaluated according to the specific process, industry, equipment, product mix, and operating conditions.
Instead of chasing an arbitrary number, manufacturers should focus on continuous improvement.
A production line moving from 62% to 70% OEE may have achieved a more meaningful improvement than another line moving from 80% to 82%.
Teams should establish baseline performance, identify the largest losses, set measurable improvement goals, and track progress over time.
Avoid Common OEE Measurement Mistakes
A successful overall equipment effectiveness guide should also address the mistakes that can undermine OEE programs.
One common problem is using inconsistent definitions. If one shift classifies a five-minute stop as downtime while another records it as a minor stop, the data becomes difficult to compare.
Another issue is focusing exclusively on the final OEE percentage.
The OEE score matters, but the components behind the score matter more. A 72% score does not explain whether the problem is downtime, slow production, or defects.
Manufacturers should also avoid using OEE as a tool for blaming operators.
OEE should identify process and equipment improvement opportunities. If employees believe the metric is being used primarily to criticize their performance, they may be less willing to report problems accurately.
The most effective OEE programs involve operators, maintenance professionals, engineers, quality teams, and management.
What OEE Will Look Like in the Future
OEE measurement is becoming increasingly automated.
Instead of collecting information manually and analyzing it at the end of a shift, factories are moving toward real-time monitoring.
Connected machines can automatically capture production states. Cloud and edge computing can process information quickly. AI can identify patterns, while digital dashboards can provide visibility across multiple facilities.
The next evolution will be making OEE increasingly predictive.
Instead of only asking, “What happened?” manufacturers will be able to ask, “What is likely to happen next, and what should we do about it?”
This shift can help organizations move from reactive performance management toward proactive production optimization.
Final Thoughts
OEE remains one of the most useful metrics for understanding manufacturing productivity in 2026. When used correctly, it provides more than a simple performance score. It helps manufacturers understand where production capacity is being lost and where improvement efforts should be focused.
Effective OEE measurement manufacturing strategies combine accurate data collection, standardized processes, employee involvement, continuous improvement, and modern technologies such as IoT, predictive maintenance, AI, and real-time analytics.
The goal should not be to chase an impressive OEE number. The goal is to understand the losses behind the number and systematically eliminate them.
As factories become smarter and more connected, manufacturers that use OEE as an actionable improvement framework will be better positioned to increase capacity, reduce waste, improve quality, and make better use of existing equipment.
Enquire About BMA Sponsorship
Looking to connect your brand with manufacturing leaders, technology experts, automation professionals, and decision-makers shaping the future of smart manufacturing?
Enquire about BMA sponsorship and explore opportunities to position your organization in front of an industry-focused audience.